





Metanova
Making drug-discovery scores easier to inspect, with the result and its supporting data together.
The problem
Metanova runs drug discovery as a competition. AI models score candidate molecules and nanobodies against protein targets, and the best submissions win on-chain. The people following it need very different things: some read chemistry, others follow the token and the competition. There was no written spec and no design system, only the raw API data and the team's scientists and engineers.
What I did
I went through the raw data with the team and checked my reading of every metric with their scientists. Then I proposed which metrics to lead with and how to show each one, and the domain experts reviewed those proposals before they went into the product. The science and the scoring are the team's work. My part was making them readable. One rule shaped all of it: never show a score without the data behind it. The dashboard and the brand come from the same system, so a 3D molecule viewer, an on-chain leaderboard and the mark on the landing page read as one product.
The surfaces
The three screens that carry the story.
What the platform is made of
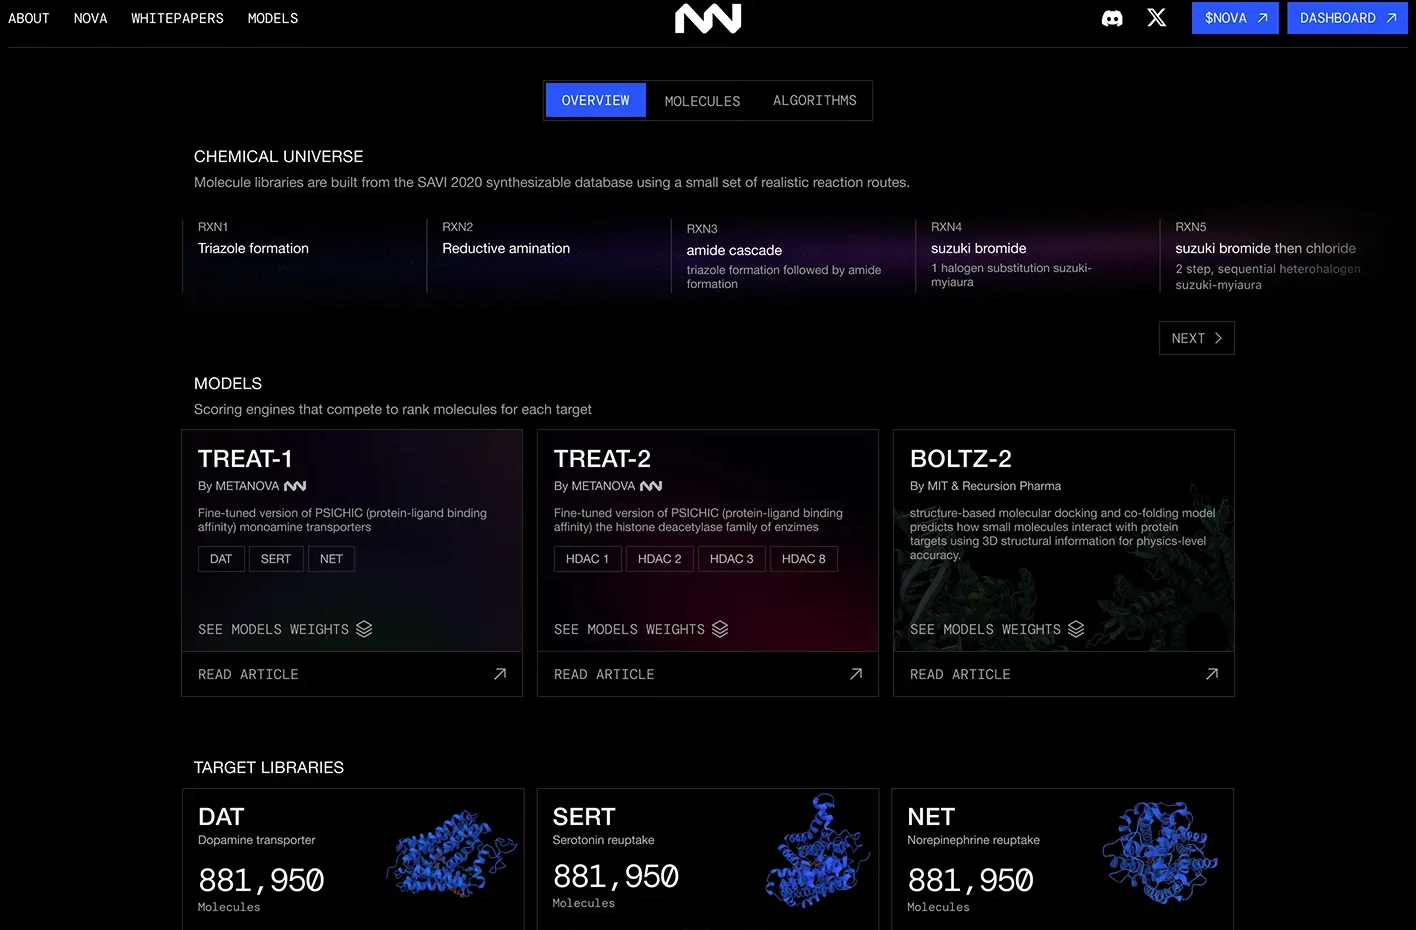
The overview explains how molecule libraries are built, which AI models compete to score them and which protein targets are in play, with a molecule count for each target library.
- Reaction routes read as a short set of steps someone new can follow.
The competition, epoch by epoch
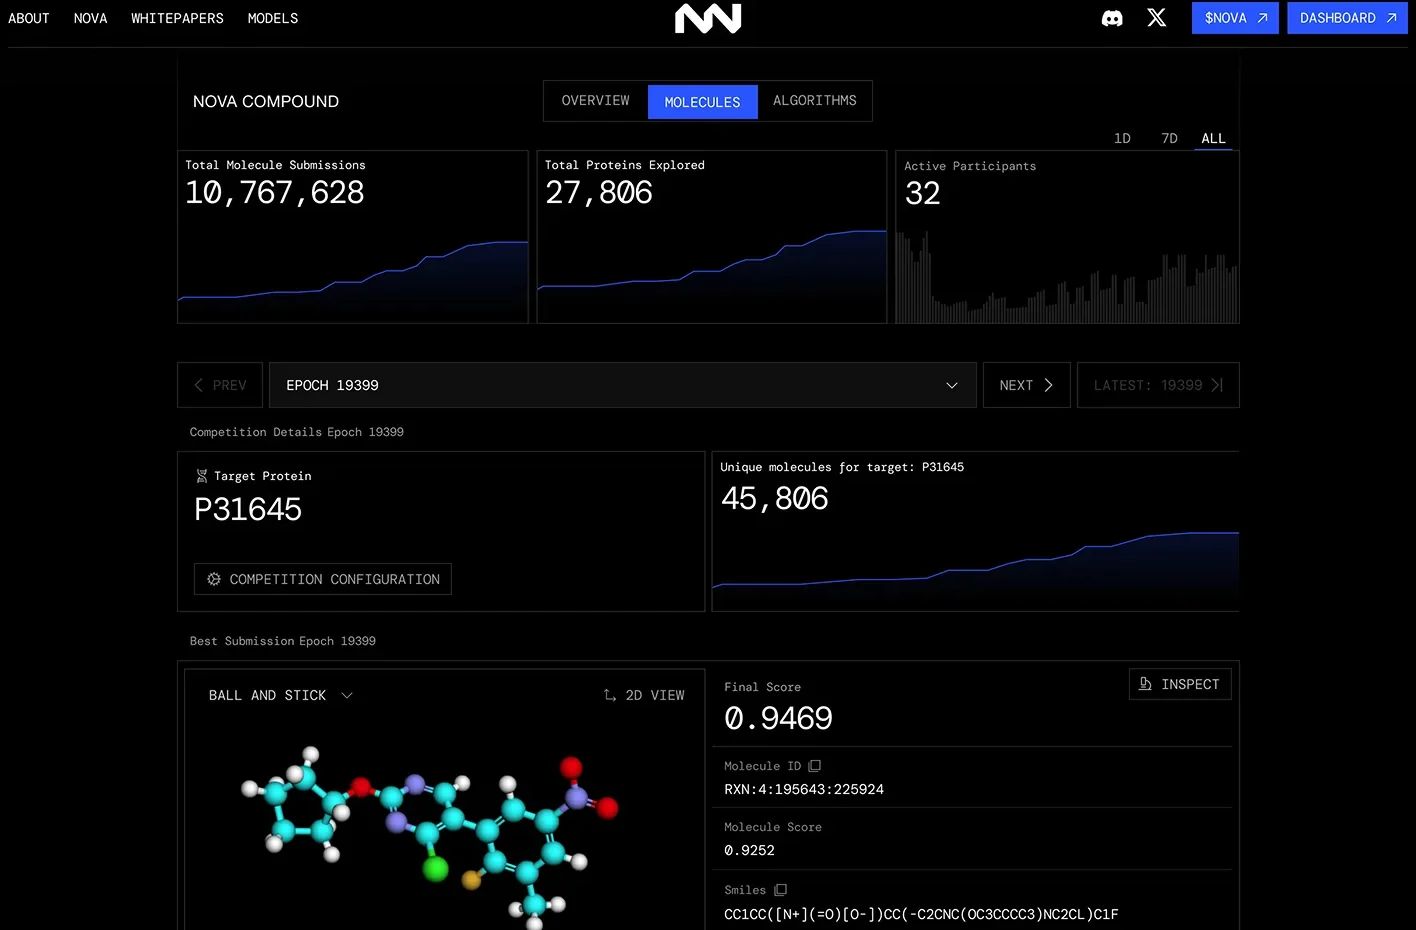
The molecules view steps through the competition in time for each target. Each epoch shows its best submission, the 3D molecule with its final score, beside the leaderboard.
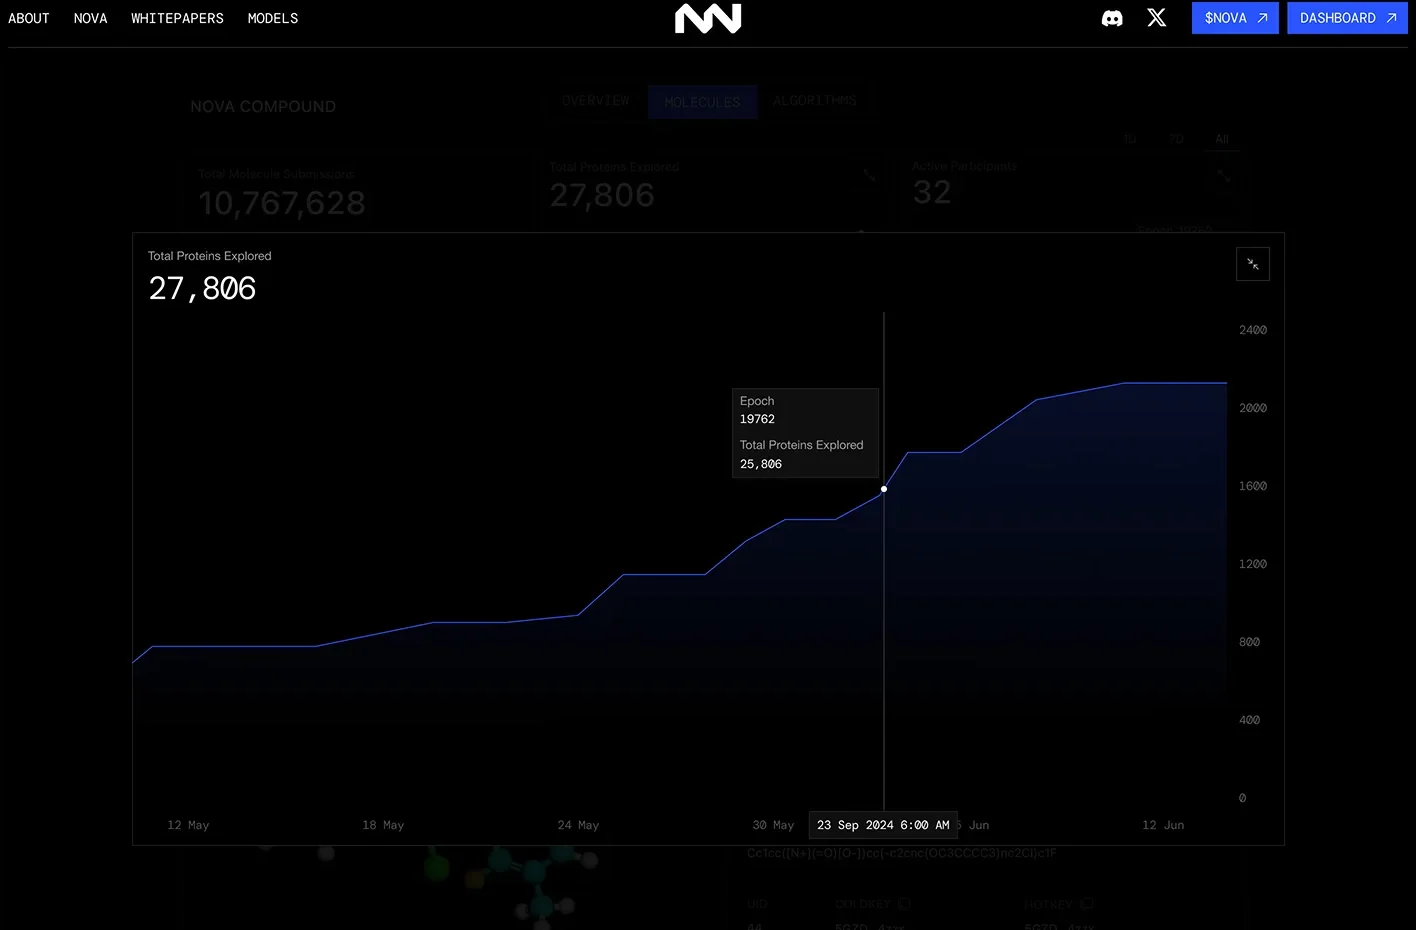
- Submissions, proteins explored and active participants set the scale at the top.
Why a submission won
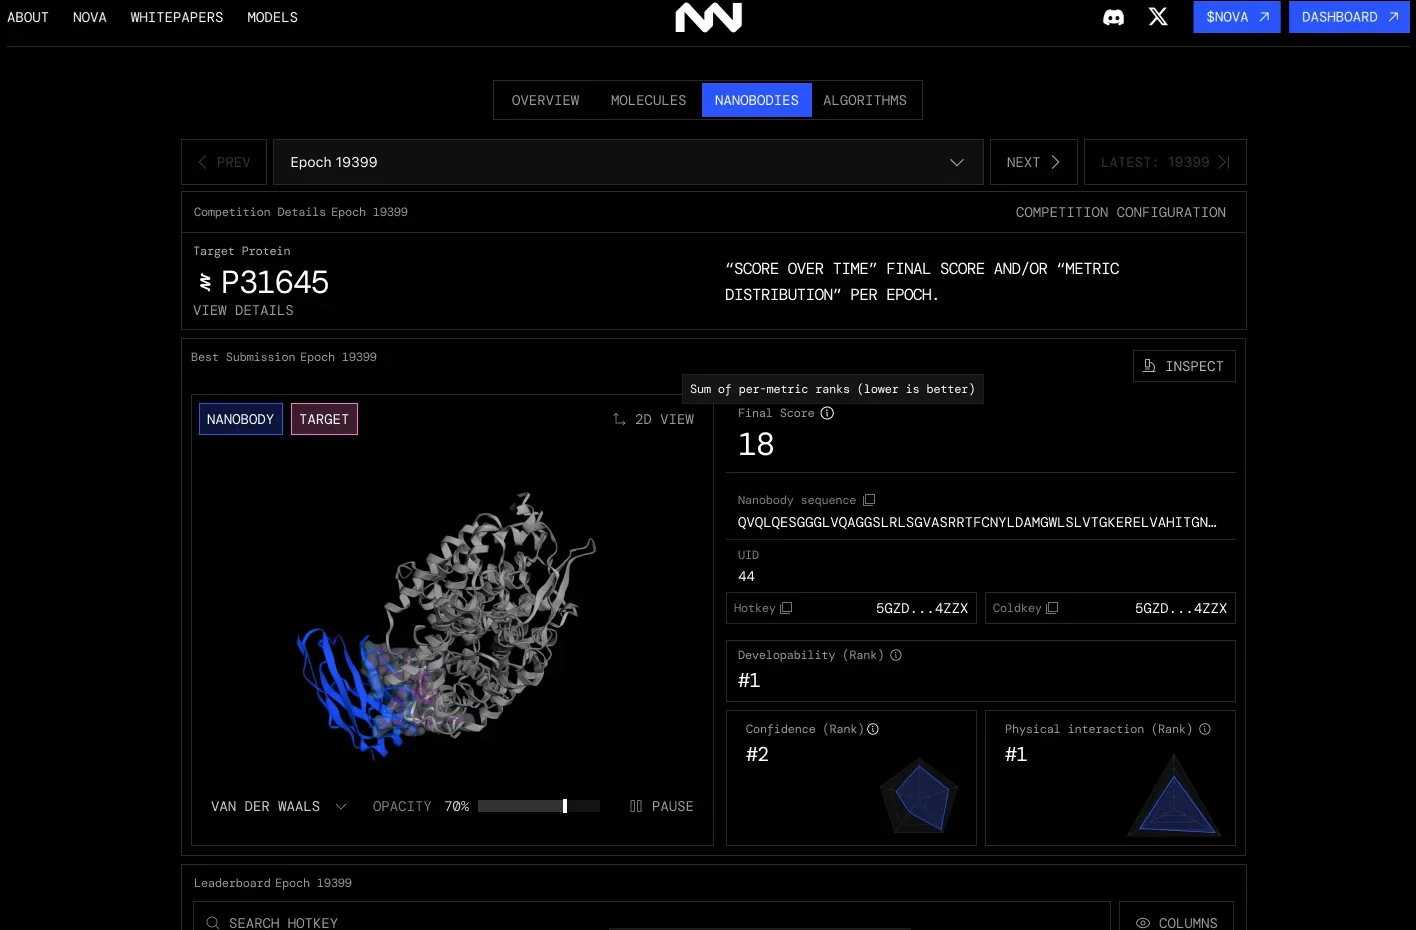
The nanobody view puts the 3D structure against its target next to the metric breakdown behind the score. The final score is the sum of ranks for developability, confidence and physical interaction, each shown on a radar chart.
- Sequence and on-chain identity tie the result to who submitted it.